

Main decision tree
Diagnostic test accuracy: the 2 × 2 table
Key points
- Sensitivity = TP / (TP + FN): the share of people WITH disease who test positive.
- Specificity = TN / (TN + FP): the share of people WITHOUT disease who test negative.
- PPV = TP / (TP + FP): how likely a positive result is a true positive.
- NPV = TN / (TN + FN): how likely a negative result is a true negative.
- SnNout: a negative result on a highly sensitive test helps rule out. SpPin: a positive result on a highly specific test helps rule in.
- With the test unchanged, higher prevalence raises PPV and lowers NPV.
- A test with 100% specificity has no false positives, so its PPV is 100%.
The 2×2 table and sensitivity
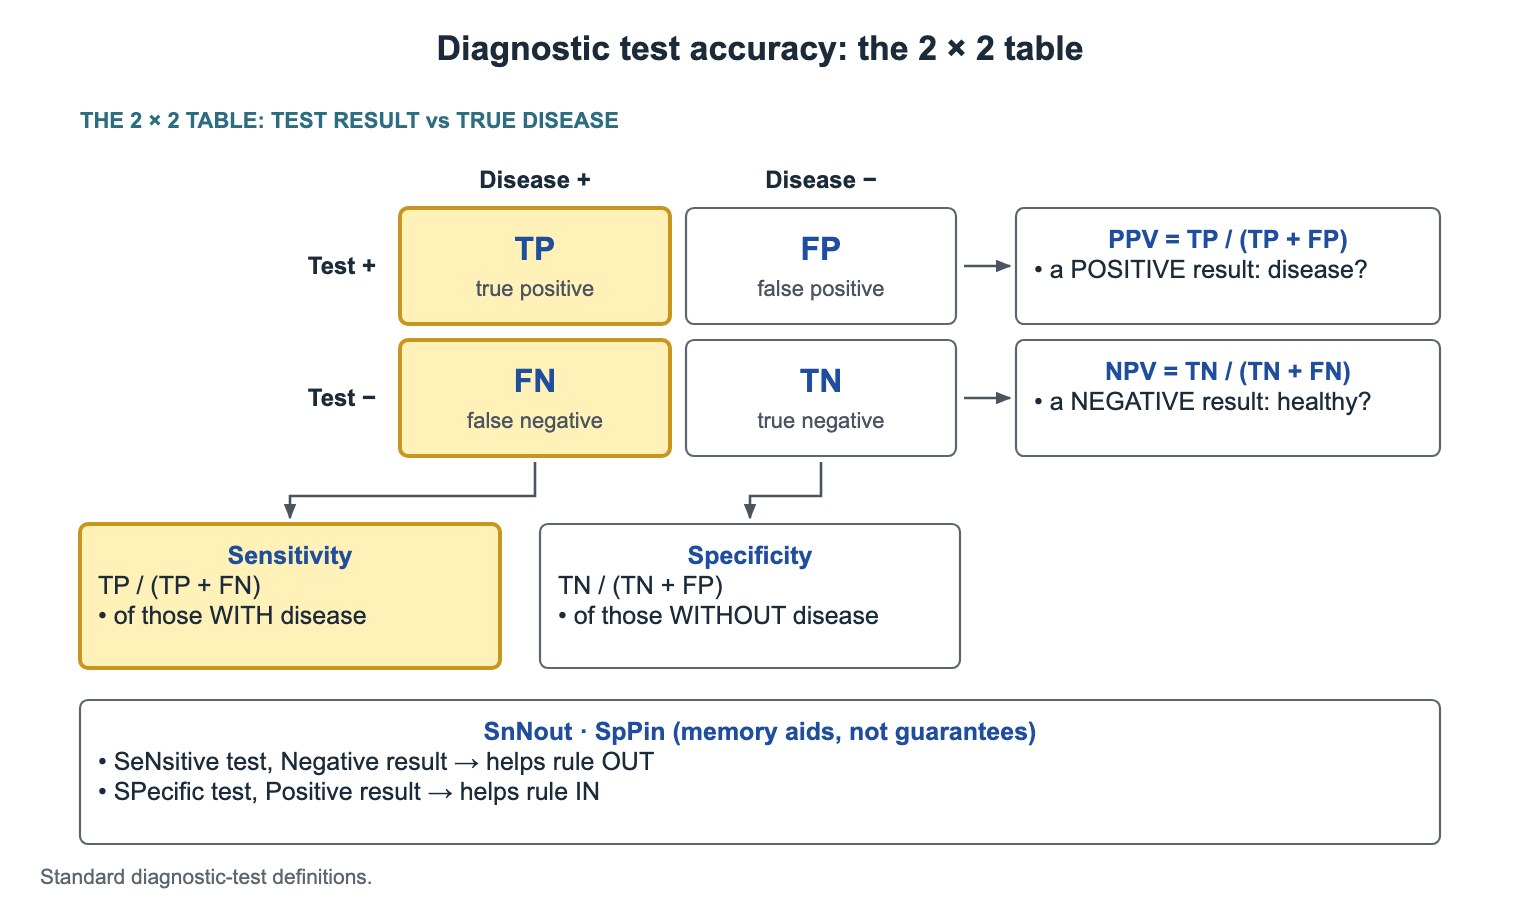
Put true disease in the columns and the test result in the rows. Each cell is one of four groups: true positive (TP), false positive (FP), false negative (FN) and true negative (TN).
Sensitivity reads down the disease-positive column. Its denominator is everyone who has the disease, so it tells you how well the test finds disease.
- Sensitivity = TP / (TP + FN).
- A highly sensitive test has few false negatives.
- Sensitivity does not change with prevalence; it is a property of the test.
Specificity
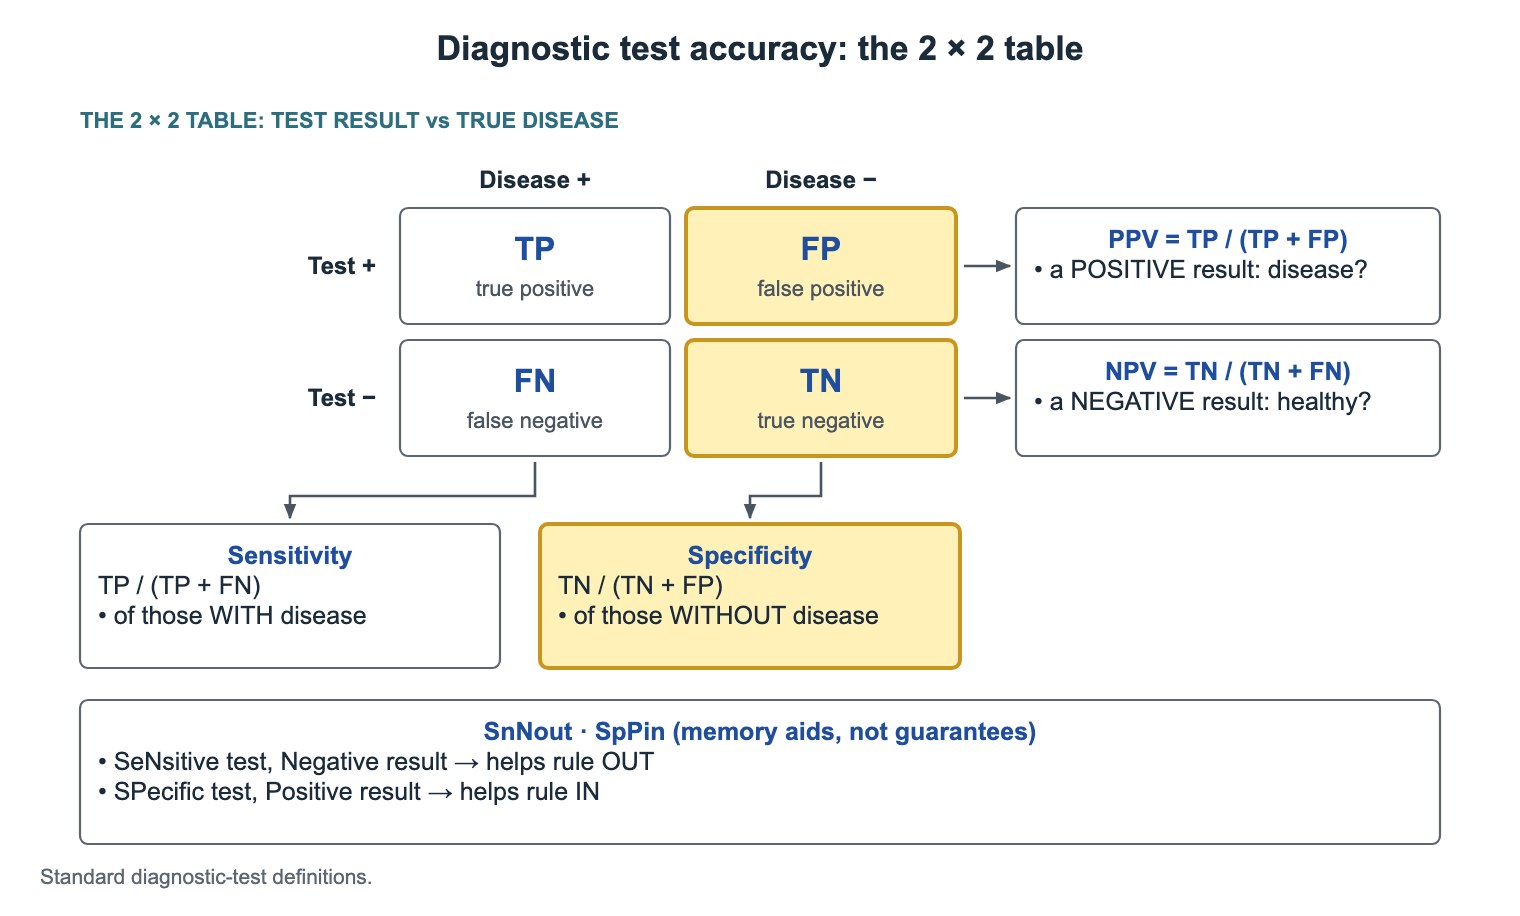
Specificity reads down the disease-negative column. Its denominator is everyone without the disease, so it tells you how well the test clears healthy people.
- Specificity = TN / (TN + FP).
- A highly specific test has few false positives.
- At 100% specificity there are no false positives, so every positive result is a true positive: PPV is 100%.
Positive and negative predictive value
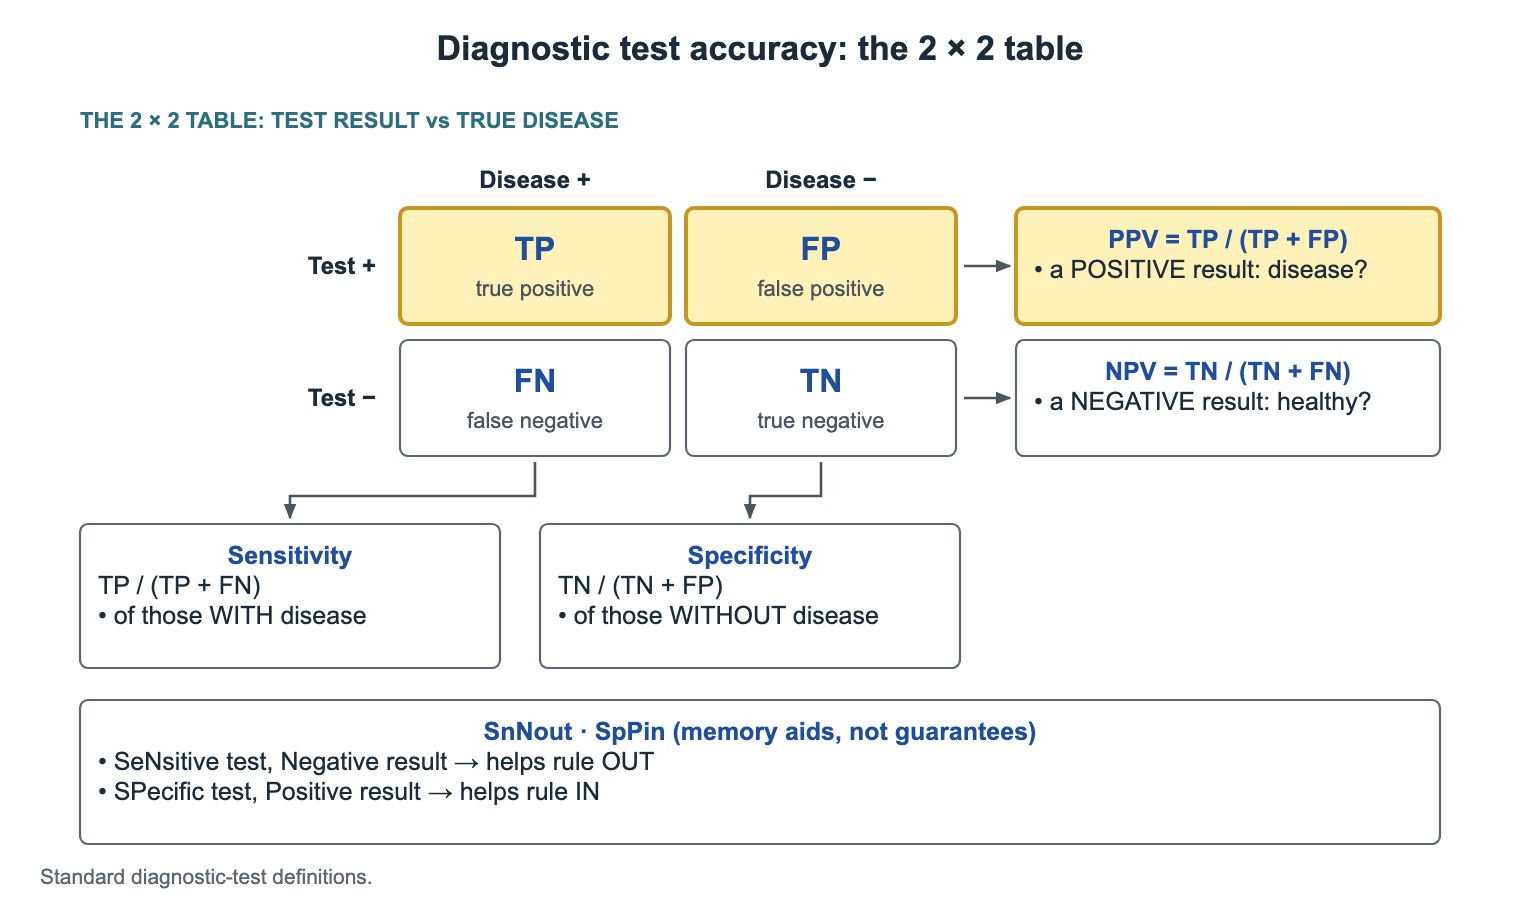
Predictive values read across the rows. They answer the patient's question: I tested positive (or negative), so how likely is it that I have (or do not have) the disease?
| Measure | Formula | Question it answers |
|---|---|---|
| PPV | TP / (TP + FP) | A positive result: does the patient have the disease? |
| NPV | TN / (TN + FN) | A negative result: is the patient truly free of it? |
SnNout and SpPin
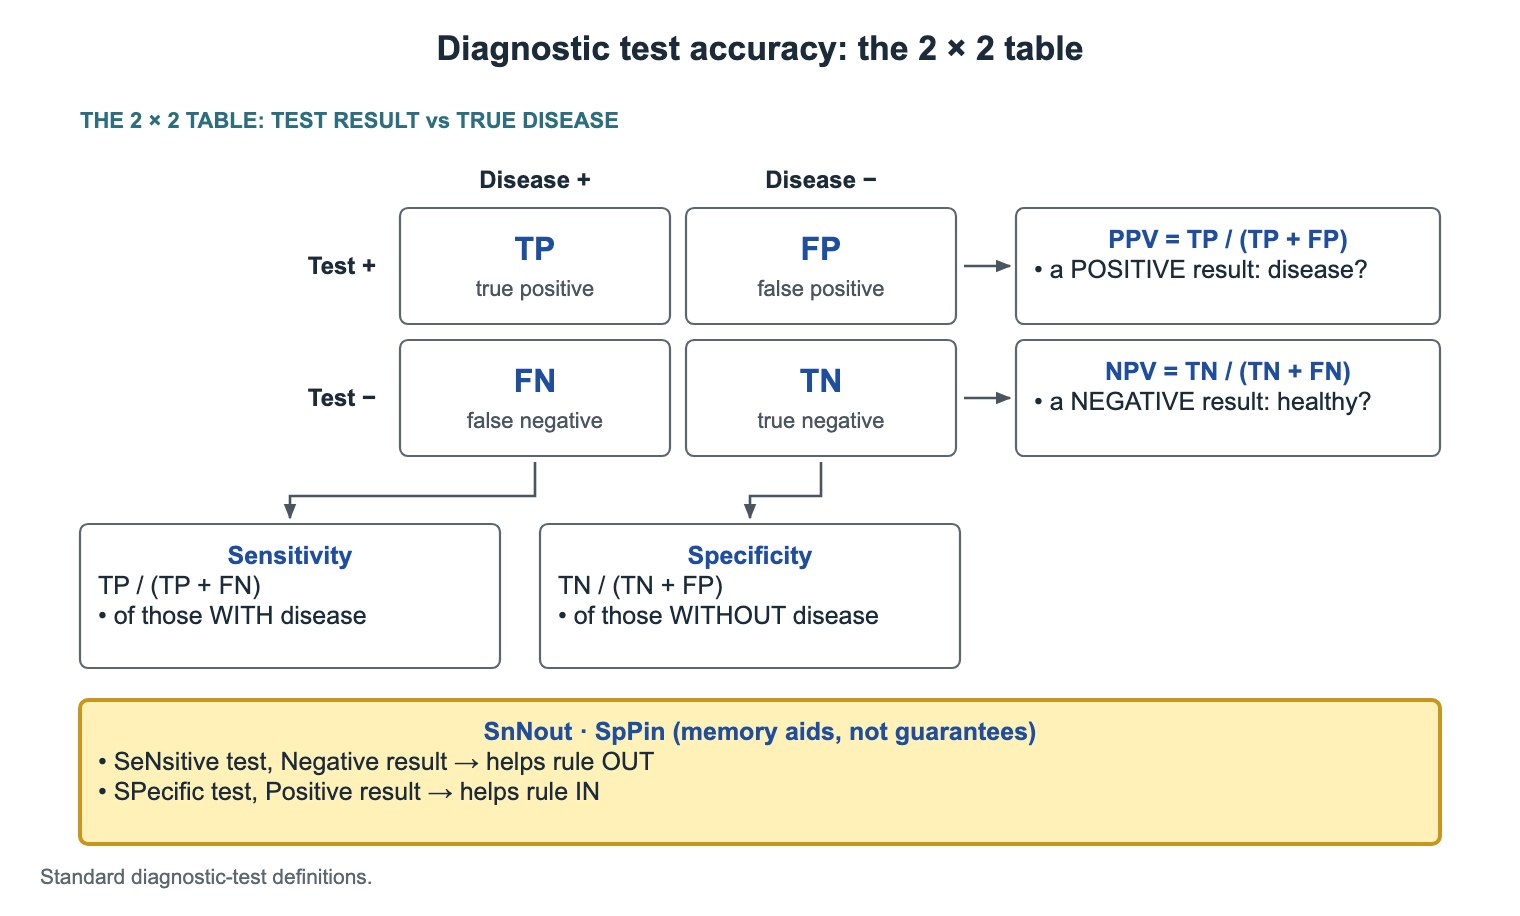
- SnNout: a SeNsitive test with a Negative result helps rule OUT disease.
- SpPin: a SPecific test with a Positive result helps rule IN disease.
- Both are memory aids, not guarantees. No test is perfect, and the pretest probability still matters.
How prevalence changes predictive values
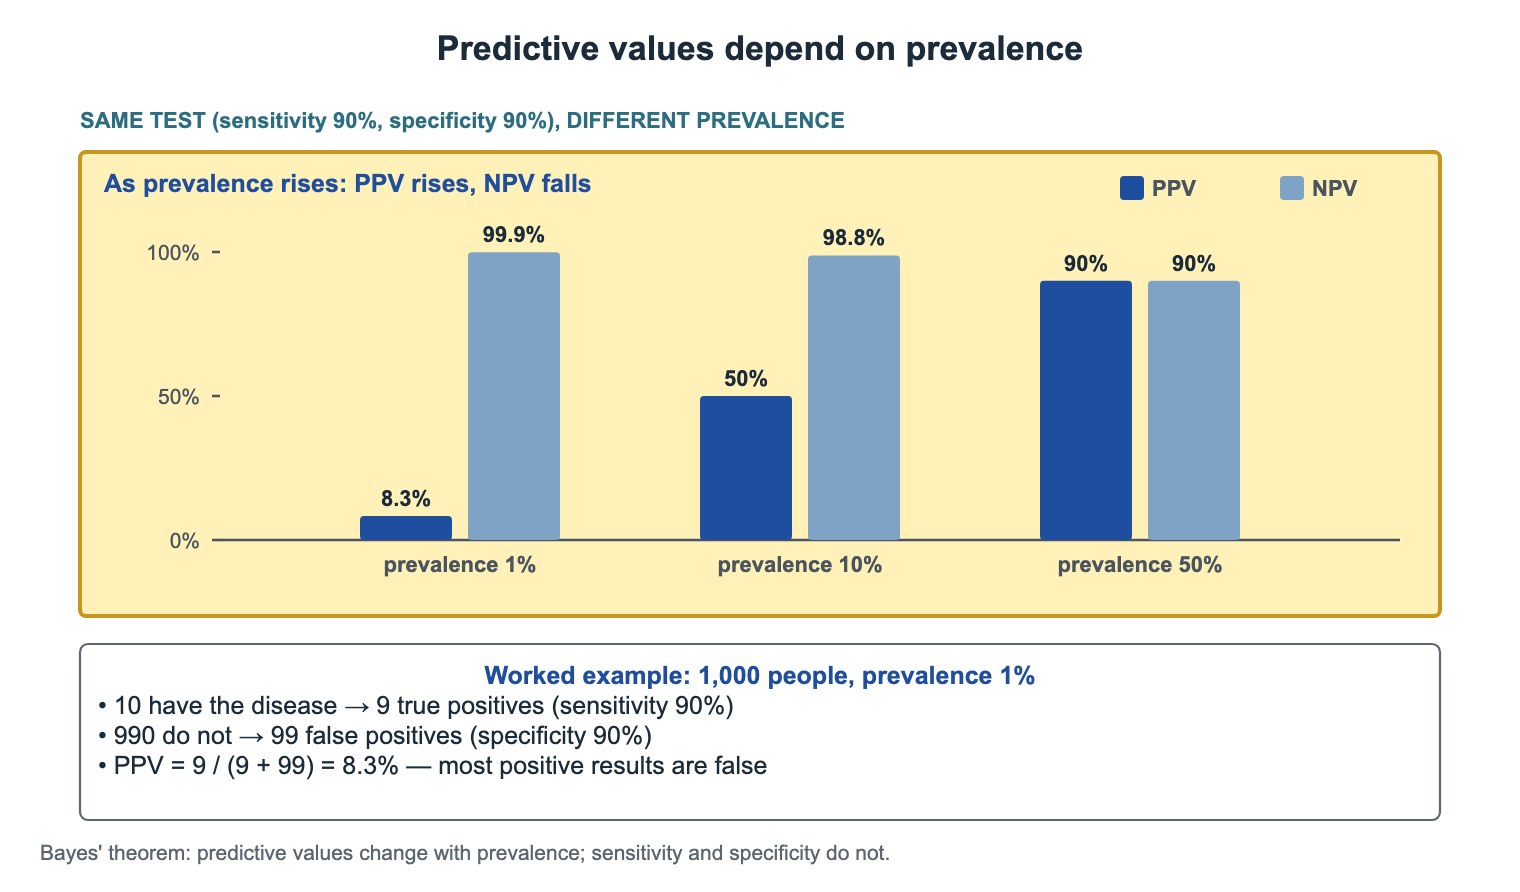
Sensitivity and specificity stay the same when the test moves to a different population. Predictive values do not.
In the tree, one test with 90% sensitivity and 90% specificity gives a PPV of 8.3% at 1% prevalence, 50% at 10% and 90% at 50%. NPV falls from 99.9% to 98.8% to 90%.
- Higher prevalence: PPV rises, NPV falls.
- Lower prevalence (for example, screening a healthy population): PPV falls, so most positive results can be false.
- This is why a positive screen is confirmed with a more specific test.
Worked example: PPV at 1% prevalence
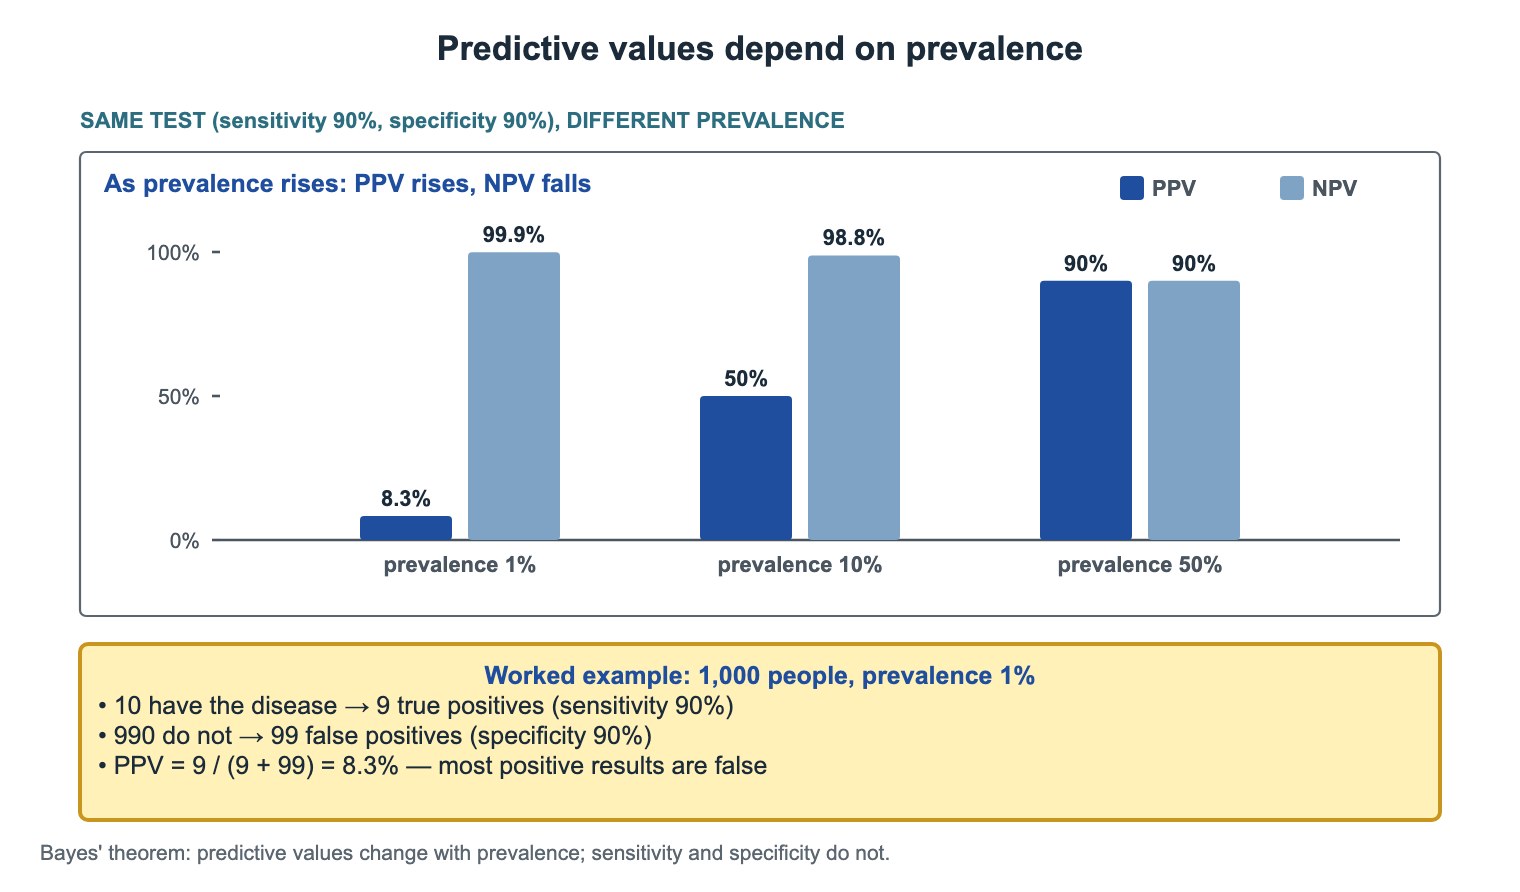
Build the table from the population first, then fill the cells. This avoids most calculation errors on the exam.
- 1,000 people, prevalence 1%: 10 have the disease and 990 do not.
- Sensitivity 90%: 9 of the 10 test positive (true positives).
- Specificity 90%: 891 of the 990 test negative, so 99 are false positives.
- PPV = 9 / (9 + 99) = 8.3%. Most positive results are false.
Common questions
What is the difference between sensitivity and PPV?
Sensitivity starts from people who have the disease and asks how many test positive. PPV starts from people who test positive and asks how many have the disease.
Does prevalence affect sensitivity and specificity?
No. Prevalence changes PPV and NPV, not sensitivity or specificity.
Which test should rule out a disease?
A highly sensitive test. A negative result on it makes the disease unlikely (SnNout).
Study this topic
Sources
- Trevethan R. Sensitivity, specificity, and predictive values: foundations, pliabilities, and pitfalls (Front Public Health 2017)
- CDC: Principles of Epidemiology in Public Health Practice, 3rd ed. (archived)
Written for Pedemy in our own words from the sources above; checked November 2026. For education only, not medical advice; check doses and local protocols before treating a patient. Pedemy is independent and not affiliated with or endorsed by the organizations cited.