

Main decision tree
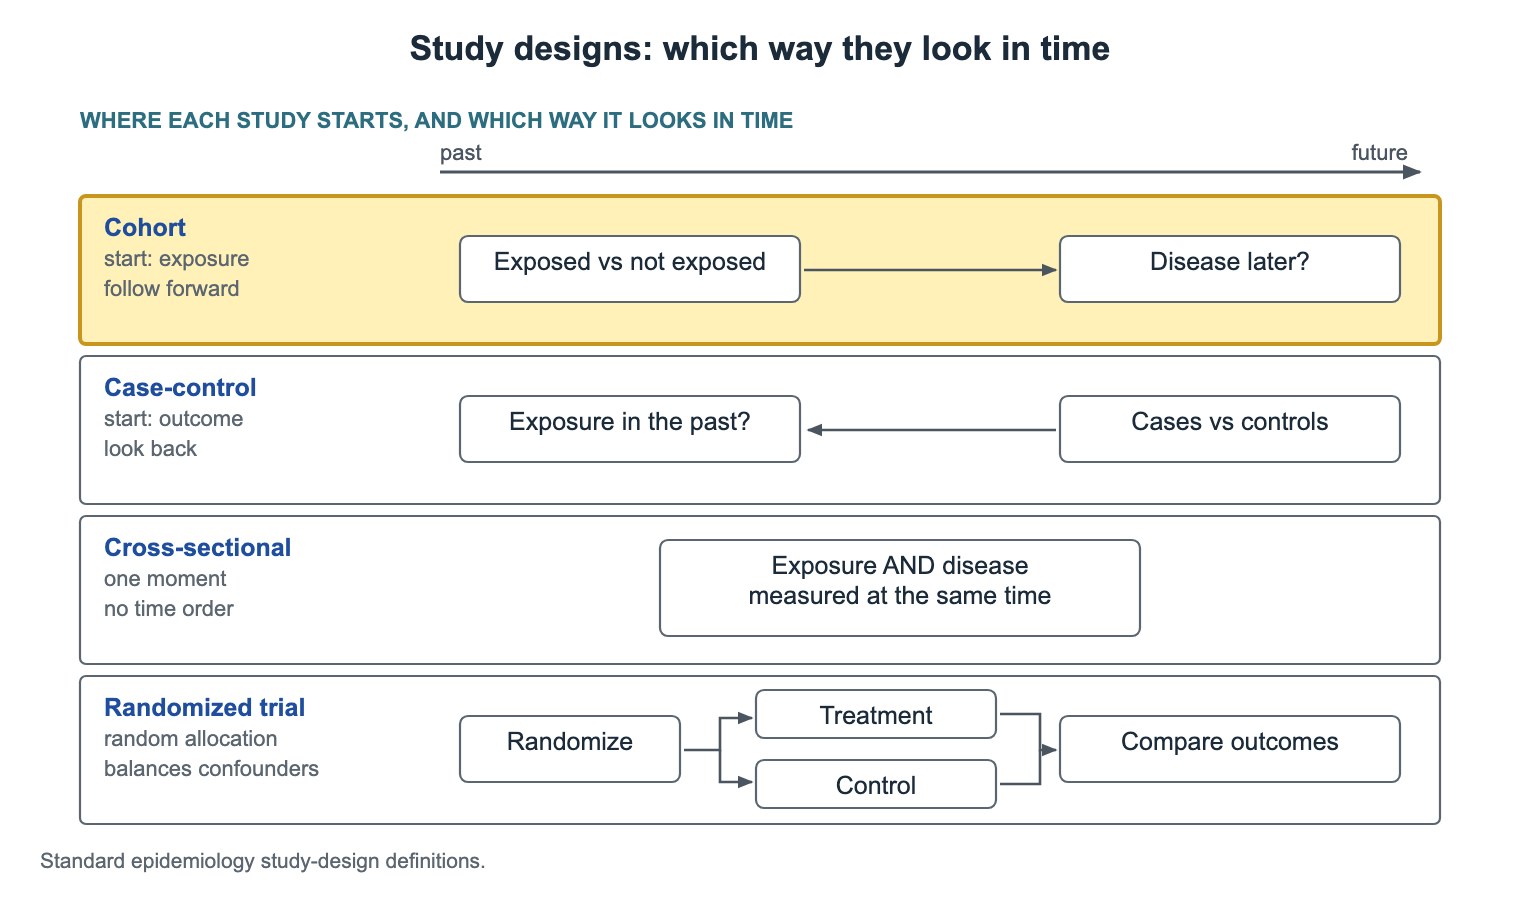
Study designs: which way they look in time
Key points
- Cohort: start from exposure and follow forward. Case-control: start from disease and look back. Cross-sectional: one moment in time.
- Randomization balances measured and unmeasured confounders on average.
- Dropouts left out of the analysis cause attrition bias; intention-to-treat analysis avoids it.
- Type I error (α) = false positive; type II error (β) = false negative; power = 1 − β.
- p < 0.05 means statistical significance under that rule, not proof of a real or clinically important effect.
- NNT = 1 / absolute risk reduction: 20% vs 15% → ARR 5% → NNT 20.
- A cure or faster death lowers prevalence; incidence is unchanged.
Study designs: which way they look in time
Cohort and case-control studies are observational: the investigator does not assign the exposure. A cross-sectional study gives prevalence but cannot show which came first.
| Design | Starts from | Direction | Clue in the stem |
|---|---|---|---|
| Cohort | Exposure (exposed vs not exposed) | Forward to later disease | Children grouped by exposure, outcomes compared later |
| Case-control | Outcome (cases vs controls) | Back to past exposure | Children with and without the disease, asked about past exposures |
| Cross-sectional | A population at one time | No time order | A survey measures exposure and disease at the same moment |
| Randomized controlled trial | Random allocation | Forward, treatment vs control | Investigators assign the treatment |
Randomized trials and intention-to-treat
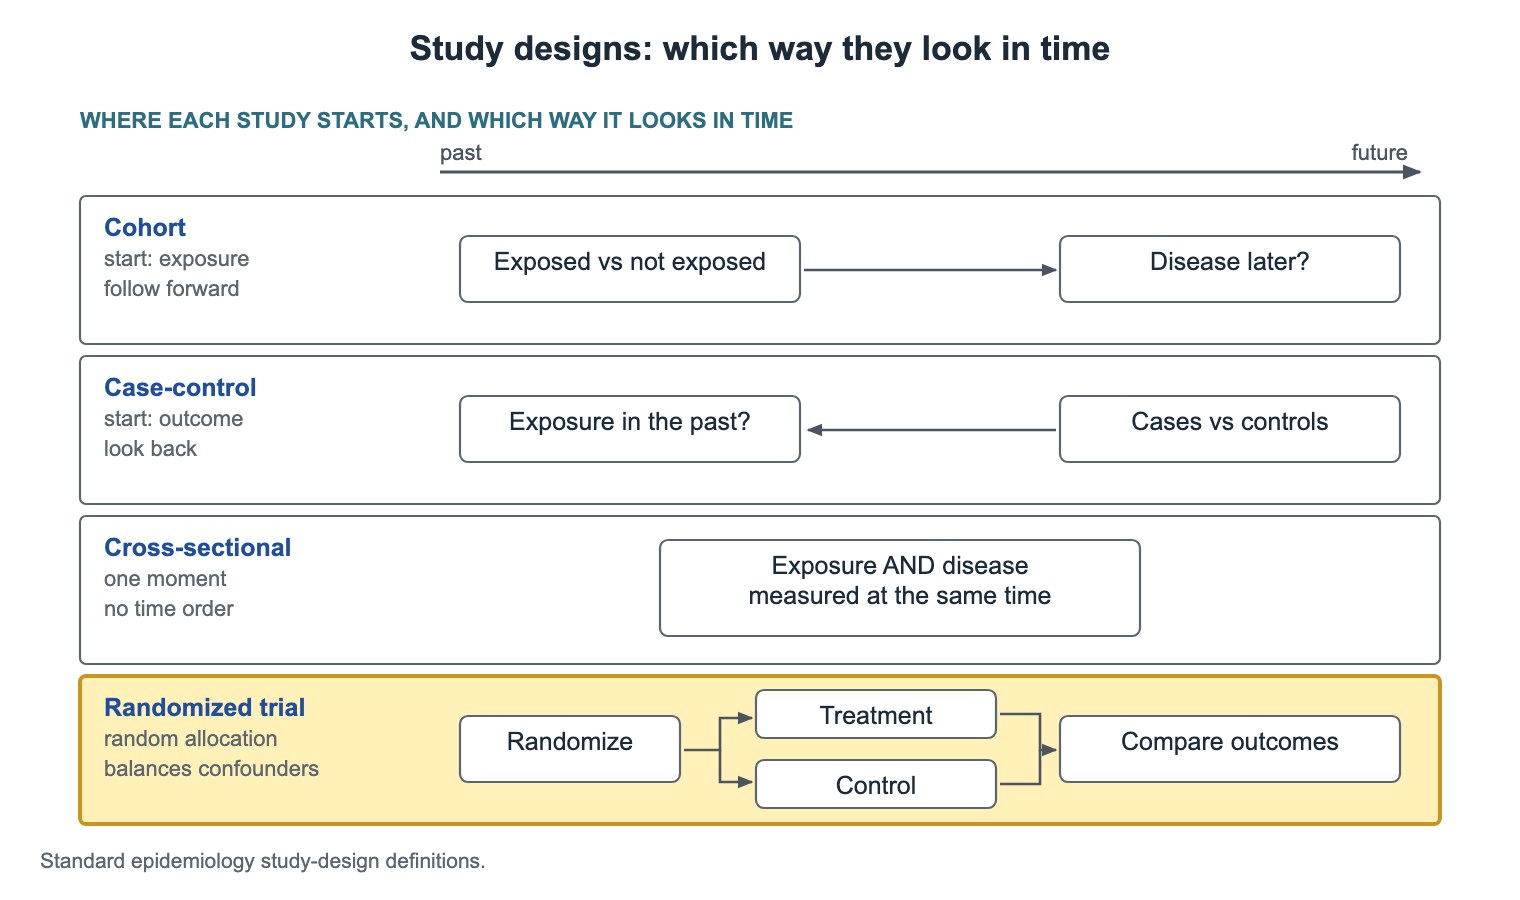
Random allocation is the main strength of an RCT. It reduces confounding because, on average, it balances baseline factors between groups, including factors nobody measured.
Children who drop out or switch groups must still be analyzed in the group they were assigned to. This is intention-to-treat analysis. Leaving dropouts out causes analysis (attrition) bias and breaks the balance randomization created.
Internal and external validity
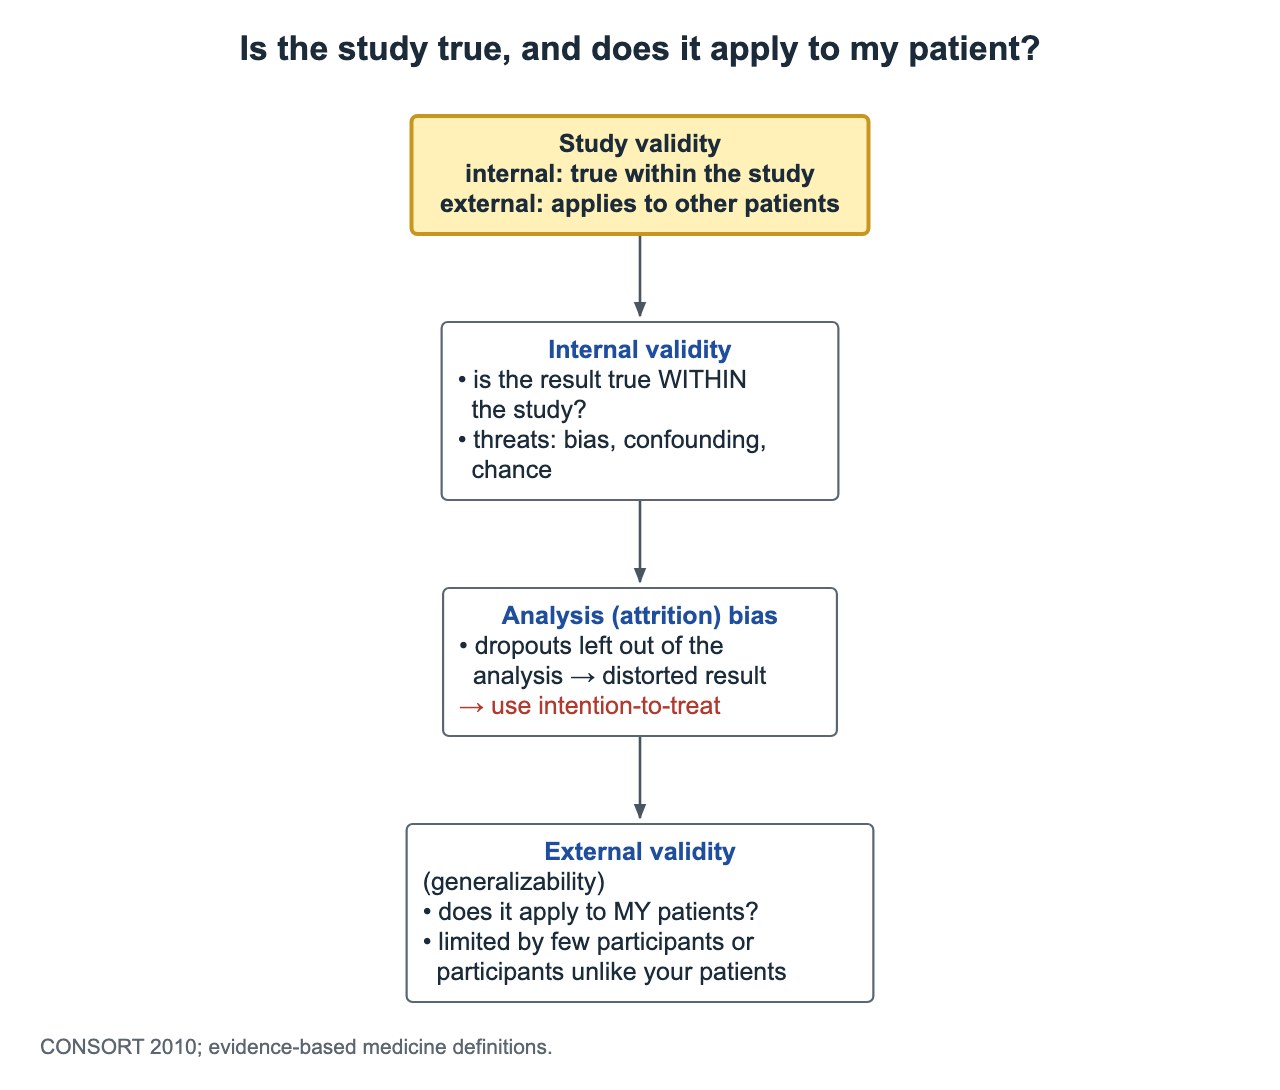
- Internal validity: is the result true within the study? Threats are bias, confounding and chance.
- Attrition (analysis) bias threatens internal validity; prevent it with intention-to-treat analysis.
- External validity (generalizability): does the result apply to my patients?
- Generalizability is limited by few participants, or by participants who differ from your patients in age, ethnicity, health status or setting.
Type I error, type II error and power
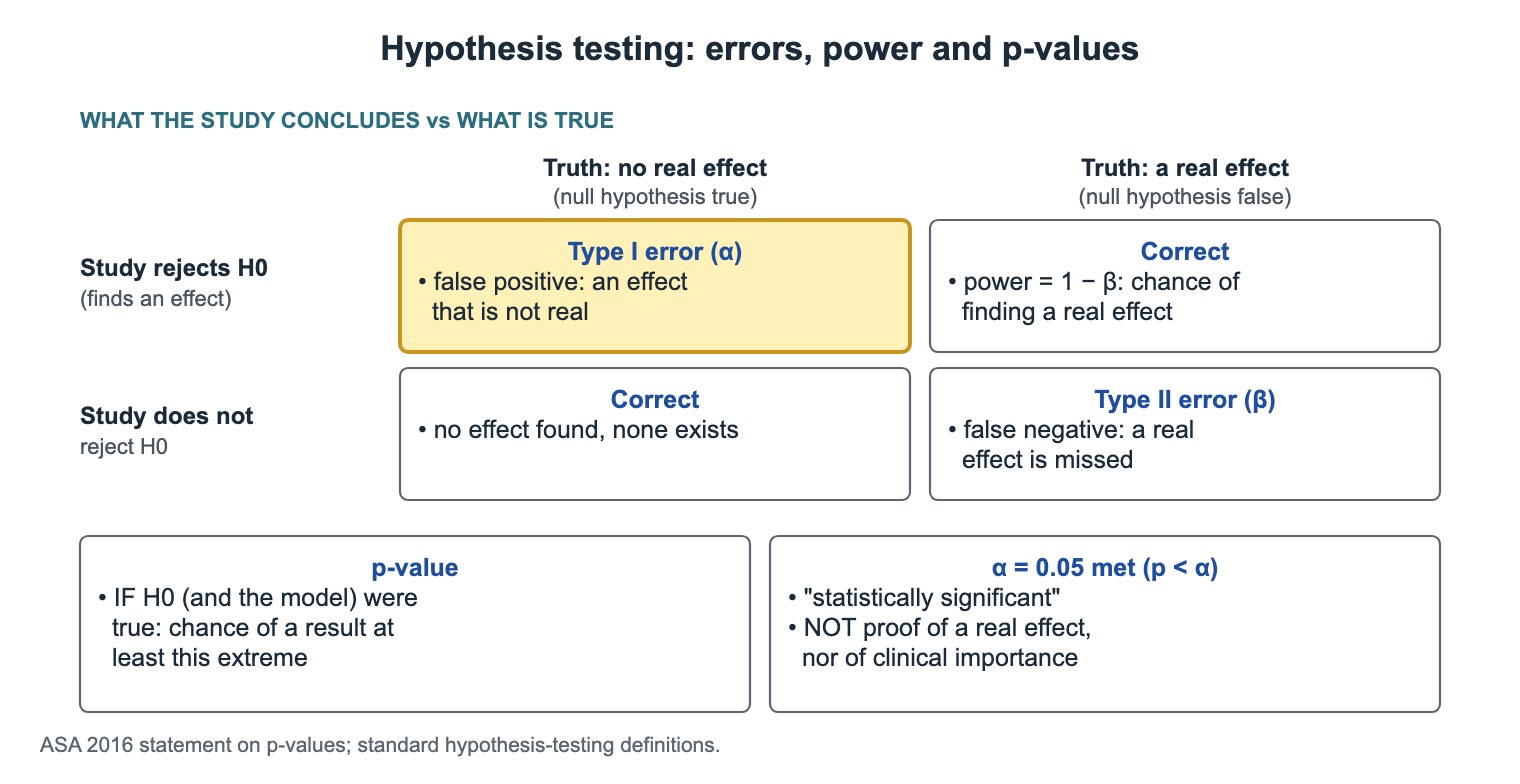
Power is the chance of finding a real effect when one exists. Small studies have low power and a higher risk of type II error.
| Truth: no real effect (H0 true) | Truth: a real effect (H0 false) | |
|---|---|---|
| Study rejects H0 | Type I error (α): false positive | Correct: power = 1 − β |
| Study does not reject H0 | Correct: no effect found, none exists | Type II error (β): false negative, a real effect is missed |
p-values and statistical significance
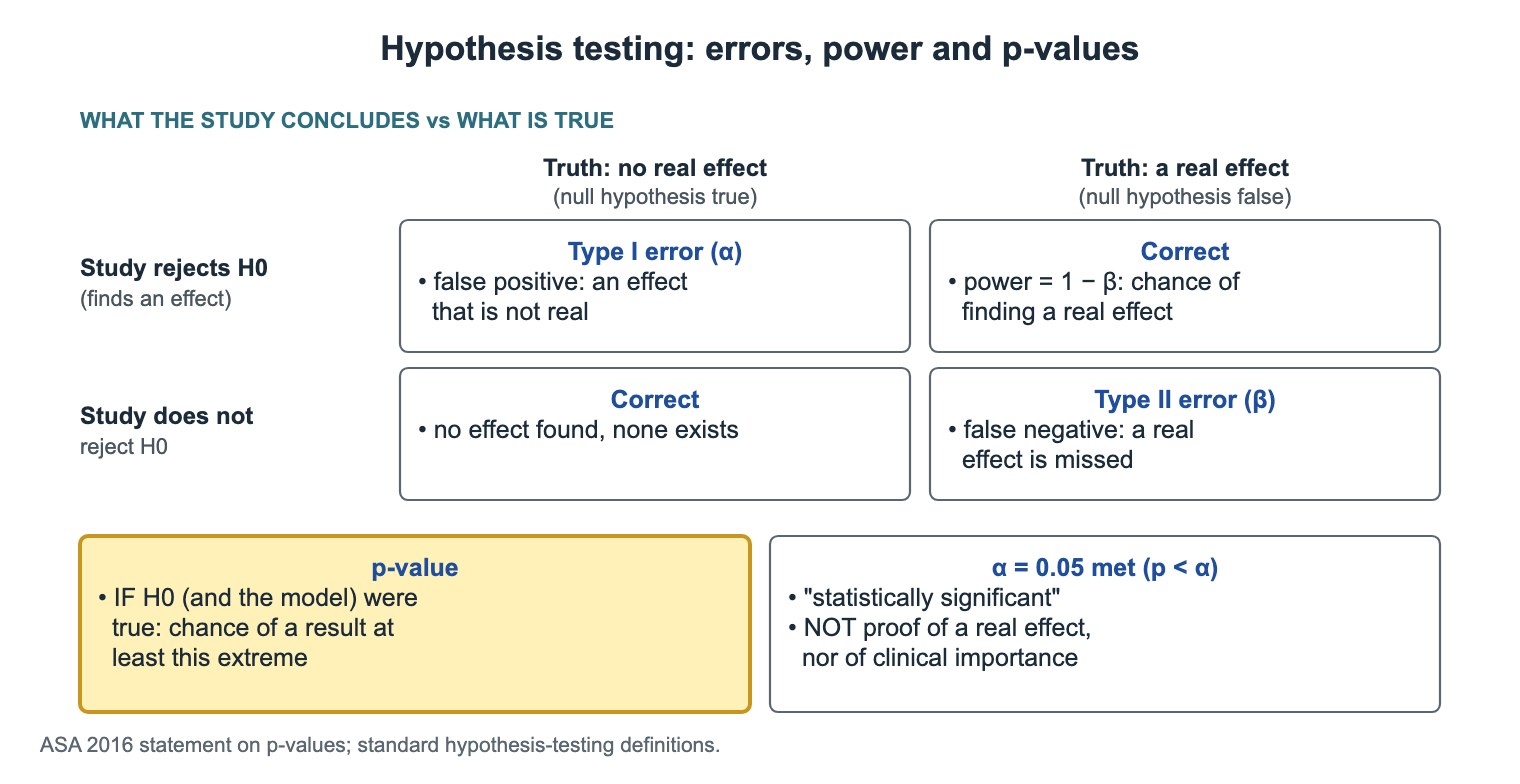
- A p-value is the probability of a result at least as extreme as the one observed, assuming the null hypothesis and the model are true.
- It is not the probability that the null hypothesis is true.
- If the trial prespecified α = 0.05 and p < 0.05, the result is statistically significant under that rule.
- Significance does not prove a real effect and does not show clinical importance. Look at the effect size and its confidence interval.
Number needed to treat
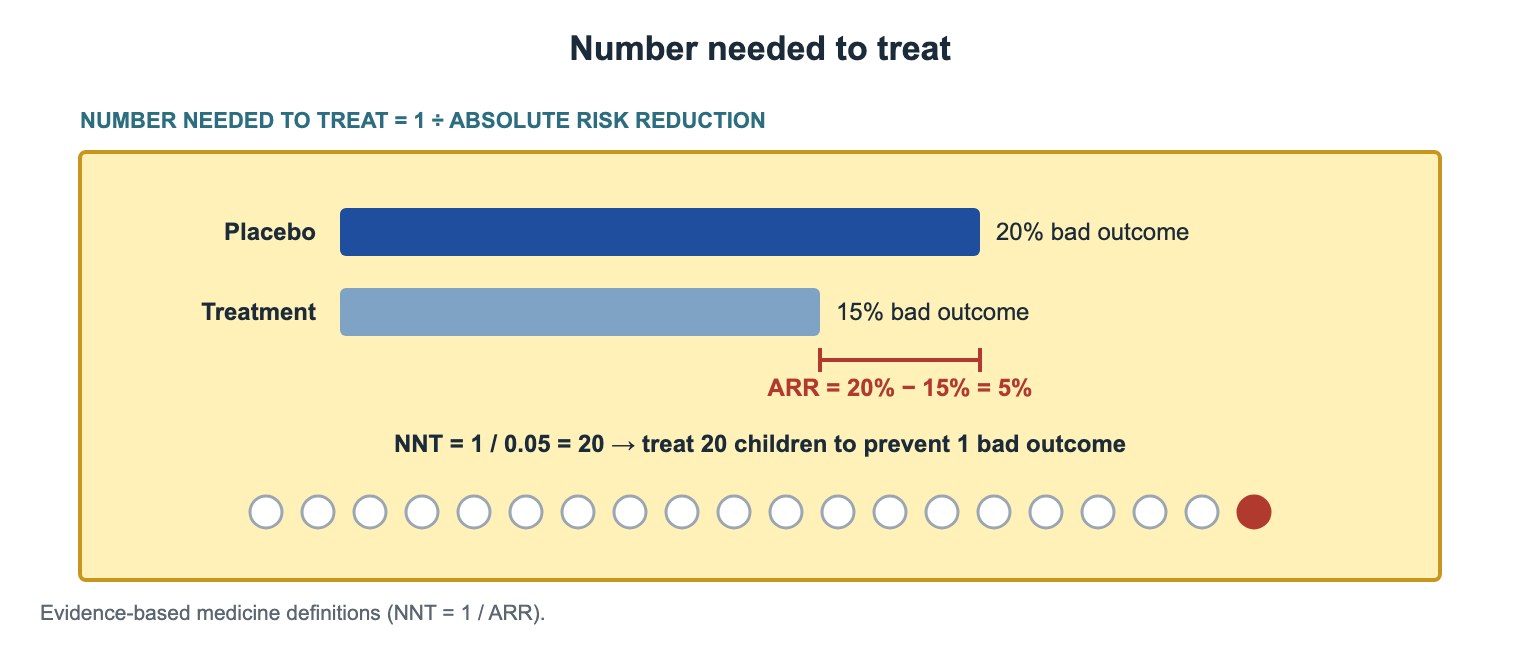
- Absolute risk reduction (ARR) = control event rate − treatment event rate.
- NNT = 1 / ARR.
- Example: bad outcome in 20% on placebo and 15% on treatment. ARR = 5% = 0.05, so NNT = 20: treat 20 children to prevent 1 bad outcome.
Prevalence and incidence
- Example: 1,200 of 10,000 surveyed children have asthma → prevalence 12%.
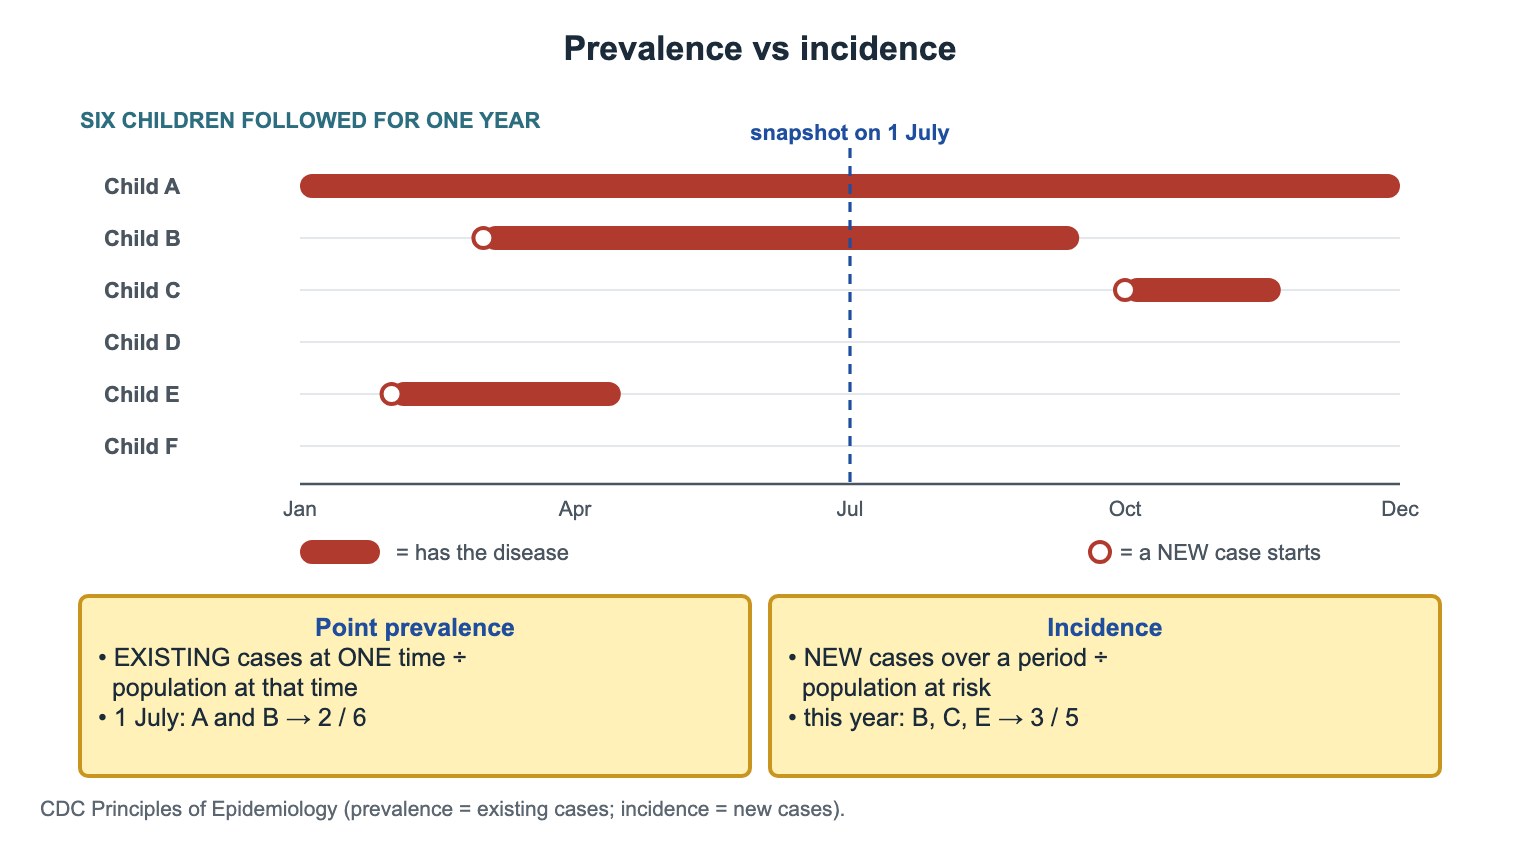
- In the tree, 2 of 6 children are ill on 1 July (point prevalence 2/6); 3 new cases arise among the 5 at risk during the year (incidence 3/5).
- Prevalence ≈ incidence × duration. A new cure, or patients dying faster, shortens duration: prevalence falls, incidence stays the same.
- A treatment that keeps patients alive longer without cure raises prevalence.
| Measure | Counts | Formula |
|---|---|---|
| Point prevalence | Existing cases at one time | Existing cases at a set time ÷ population at that time |
| Period prevalence | Anyone with the condition at any time in an interval | Cases during the interval ÷ population |
| Incidence | New cases over a period | New cases in the period ÷ population at risk |
Common questions
What is the difference between a cohort and a case-control study?
A cohort study groups people by exposure and follows them for the outcome. A case-control study groups people by outcome and looks back for past exposure.
What does a p-value of 0.05 mean?
If there were truly no effect, a result at least this extreme would occur about 5% of the time. It does not mean a 95% chance that the effect is real.
How do you calculate number needed to treat?
NNT = 1 / absolute risk reduction. A drop from 20% to 15% is an ARR of 0.05, so NNT = 20.
Study this topic
Sources
- CONSORT 2025 statement: updated guideline for reporting randomised trials (BMJ 2025)
- Wasserstein RL, Lazar NA. The ASA statement on p-values: context, process, and purpose (Am Stat 2016)
- CDC: Principles of Epidemiology in Public Health Practice, 3rd ed. (archived)
Written for Pedemy in our own words from the sources above; checked November 2026. For education only, not medical advice; check doses and local protocols before treating a patient. Pedemy is independent and not affiliated with or endorsed by the organizations cited.